


In her New Year letter to investors, Cathie Wood, CEO and CIO of ARK Invest, outlines a profound structural transformation in the U.S. and global economy. Far from anticipating a prolonged slowdown, the renowned investor describes today’s economy as a “coiled spring,” poised for a powerful rebound driven by the convergence of disruptive technologies such as artificial intelligence, robotics, blockchain, and biotechnology.
Wood argues that the combination of deregulation, tax reductions, declining inflation, and accelerating productivity could give rise to one of the most powerful growth cycles in modern economic history. Within this framework, she analyzes the outlook for the U.S. dollar, gold, bitcoin, equity markets, and the explosive expansion of the artificial intelligence ecosystem, presenting an optimistic yet strategically grounded vision for the years ahead. Read the letter below:
COILED SPRING
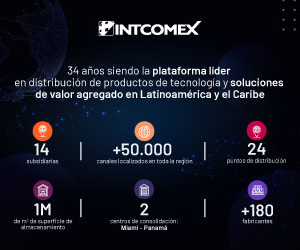
Despite sustained real gross domestic product (GDP) growth during the past three years, the underlying US economy has suffered a rolling recession and has evolved into a coiled spring that could bounce back powerfully during the next few years. In response to COVID-related supply shocks, the record-breaking 22-fold surge in the Fed funds rate from 0.25% in March 2022 to 5.5% in the sixteen months ended July 2023 pushed housing, manufacturing, non-AI capital spending, and low-to-middle income America into recession, as illustrated in the charts below.
As measured by existing home sales, housing dropped 40% from 5.9 million at an annual rate in January 2021 to 3.5 million in October 2023, a level last seen in November 2010 and around which it has fluctuated for the past two years. Illustrating how tightly the spring has coiled, existing home sales are as low as they were in the early 1980s when the US population was ~35% lower than today.
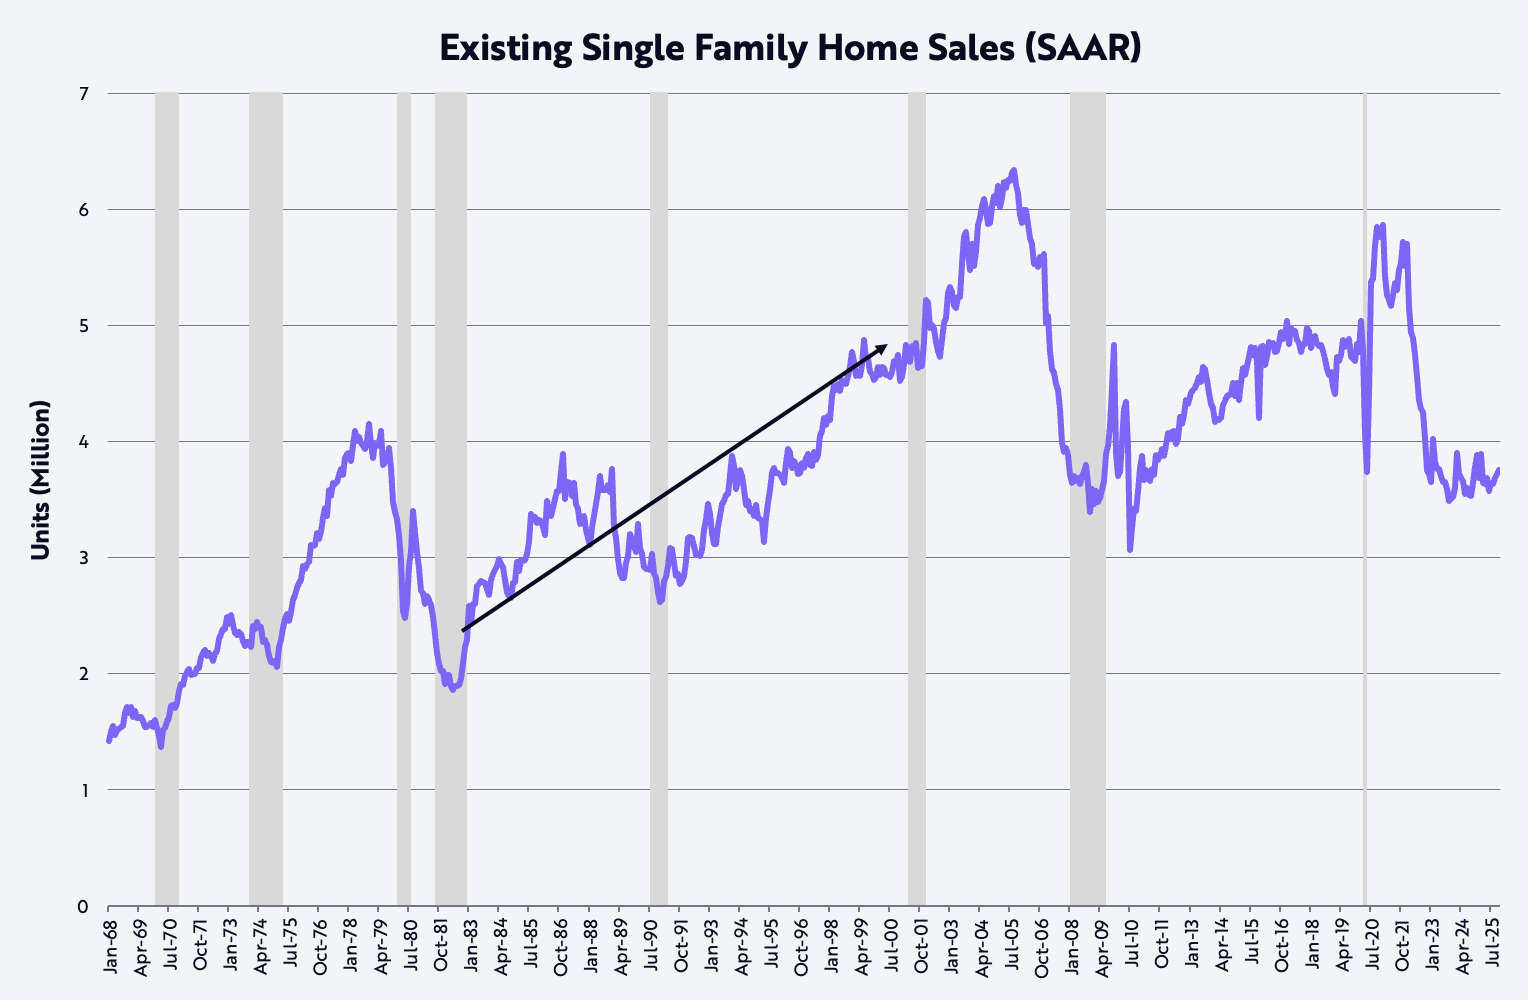
As measured by the US PMI (Purchasing Managers Index), manufacturing has been contracting for roughly three years. According to this diffusion index, 50 is the demarcation point between expansion and contraction, as shown below.
Meanwhile, capital spending, as measured by non-defense capital goods excluding aircraft, peaked in mid-2022, a level to which it has just returned both with and without technology. Indeed, since its blowoff in the tech and telecom bubble, this measure of capital spending had struggled for more than 20 years to break out, until 2021 when COVID-related supply shocks forced a step-up in both digital and physical investment. What once was the cap in spending seems to have become a floor now that the AI, robotics, energy storage, blockchain technology, and multiomics sequencing platforms are ready for prime time. After the tech and telecom bubble of the nineties, a 20-year peaking process around $70 billion has given way to what could become the most powerful capital spending cycle in history, as illustrated below. In our view, an AI bubble is years away!
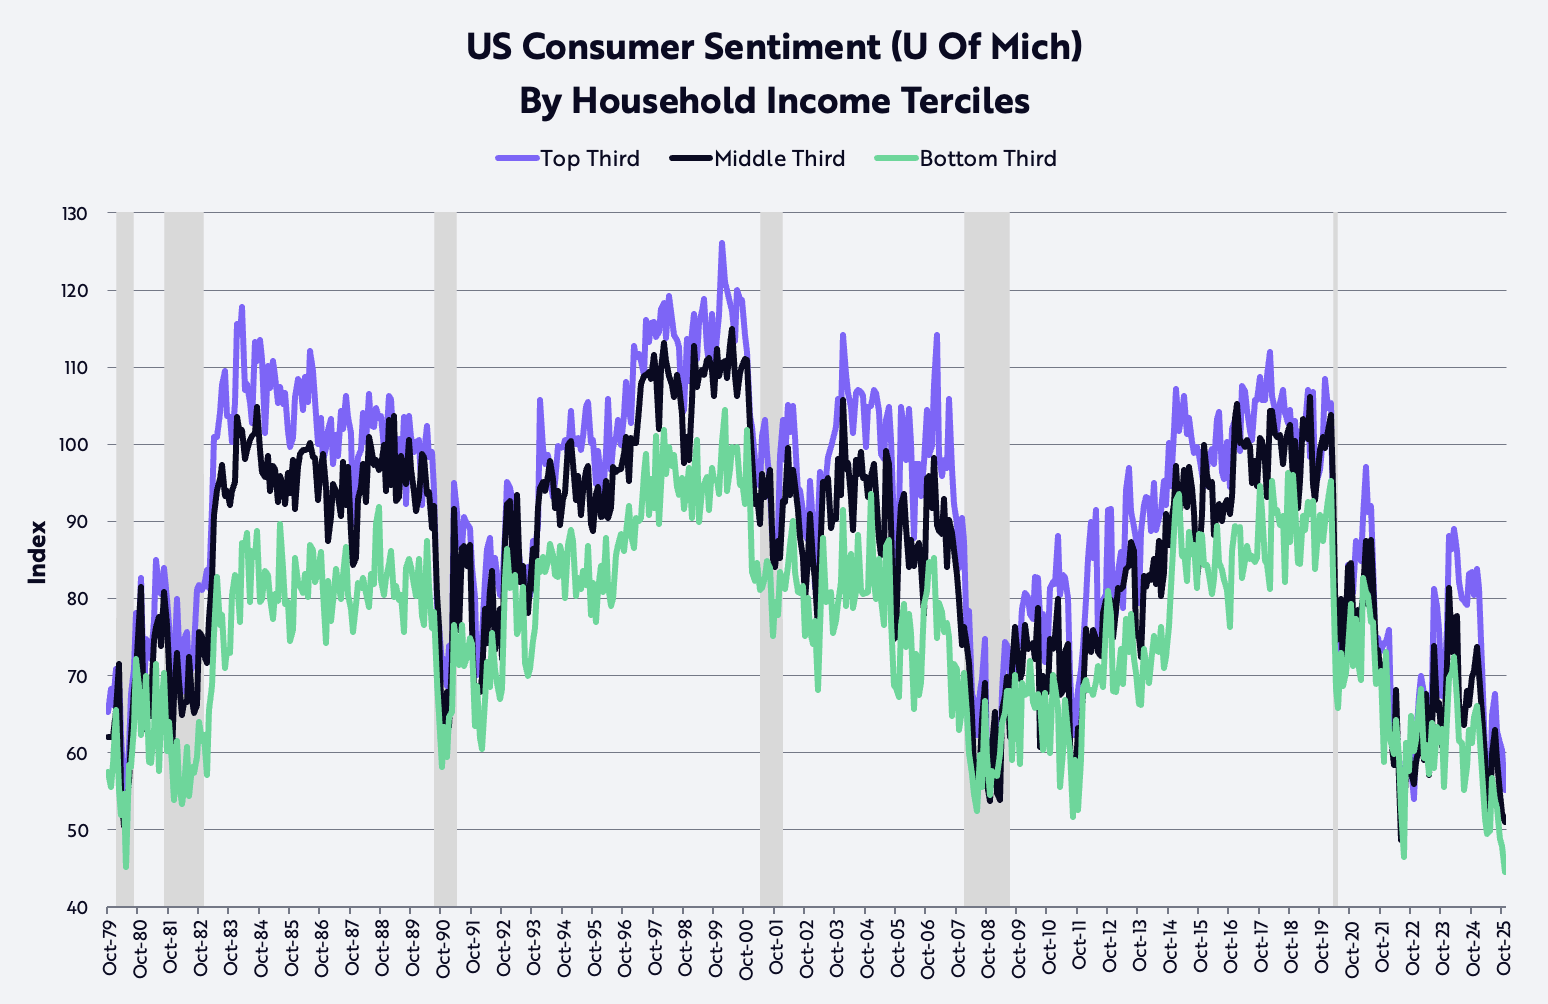
Meanwhile, as measured by the University of Michigan, the sentiment of low- and middle-income earners has not been this low since the early eighties when double-digit inflation and interest rates ravaged purchasing power and pushed the US economy into back-to-back recessions. Moreover, in recent months, high income sentiment has capitulated as well, as shown below. In our view, consumer sentiment is one of the springs most tightly coiled and ripe for a rebound.
Deregulation Alongside Lower Taxes, Inflation, And Interest Rates
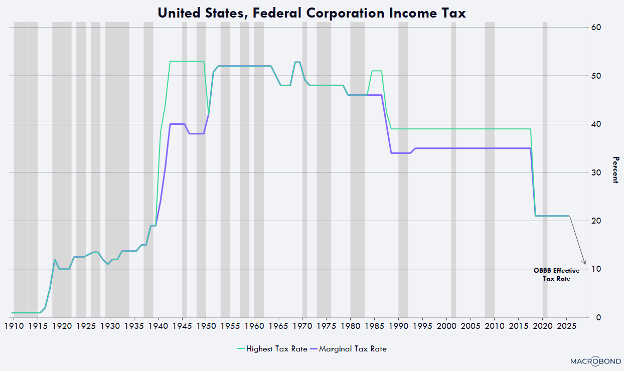
Thanks to the confluence of deregulation and lower taxes (including tariffs), inflation, and interest rates, the rolling recession which has characterized the last few years in the US could turn quickly and sharply during the next year and beyond. Deregulation is unleashing innovation in every sector, led by the first AI and Crypto Czar, David Sacks, in the AI and digital assets space. Meanwhile, lower taxes on tips, overtime, and social security should hand US consumers significant refunds this quarter, potentially driving real disposable income growth up from ~2% at an annual rate during the second half of 2025 to ~8.3% this quarter. In addition, corporate tax refunds should surge, as accelerated depreciation on manufacturing facilities, equipment, software, and domestic research and development (R&D) pushes the effective corporate tax rate down toward 10%, as shown below, one of the lowest rates in the world. Any company starting construction of a manufacturing facility in the US before the end of 2028, for example, will benefit from full depreciation in the building’s first year of service, instead of stretching it out over 30 to 40 years. Equipment, software, and domestic R&D also will enjoy 100% depreciation in year one, a cash flow benefit which last year’s budget bill made permanent and retroactive to January 1, 2025.
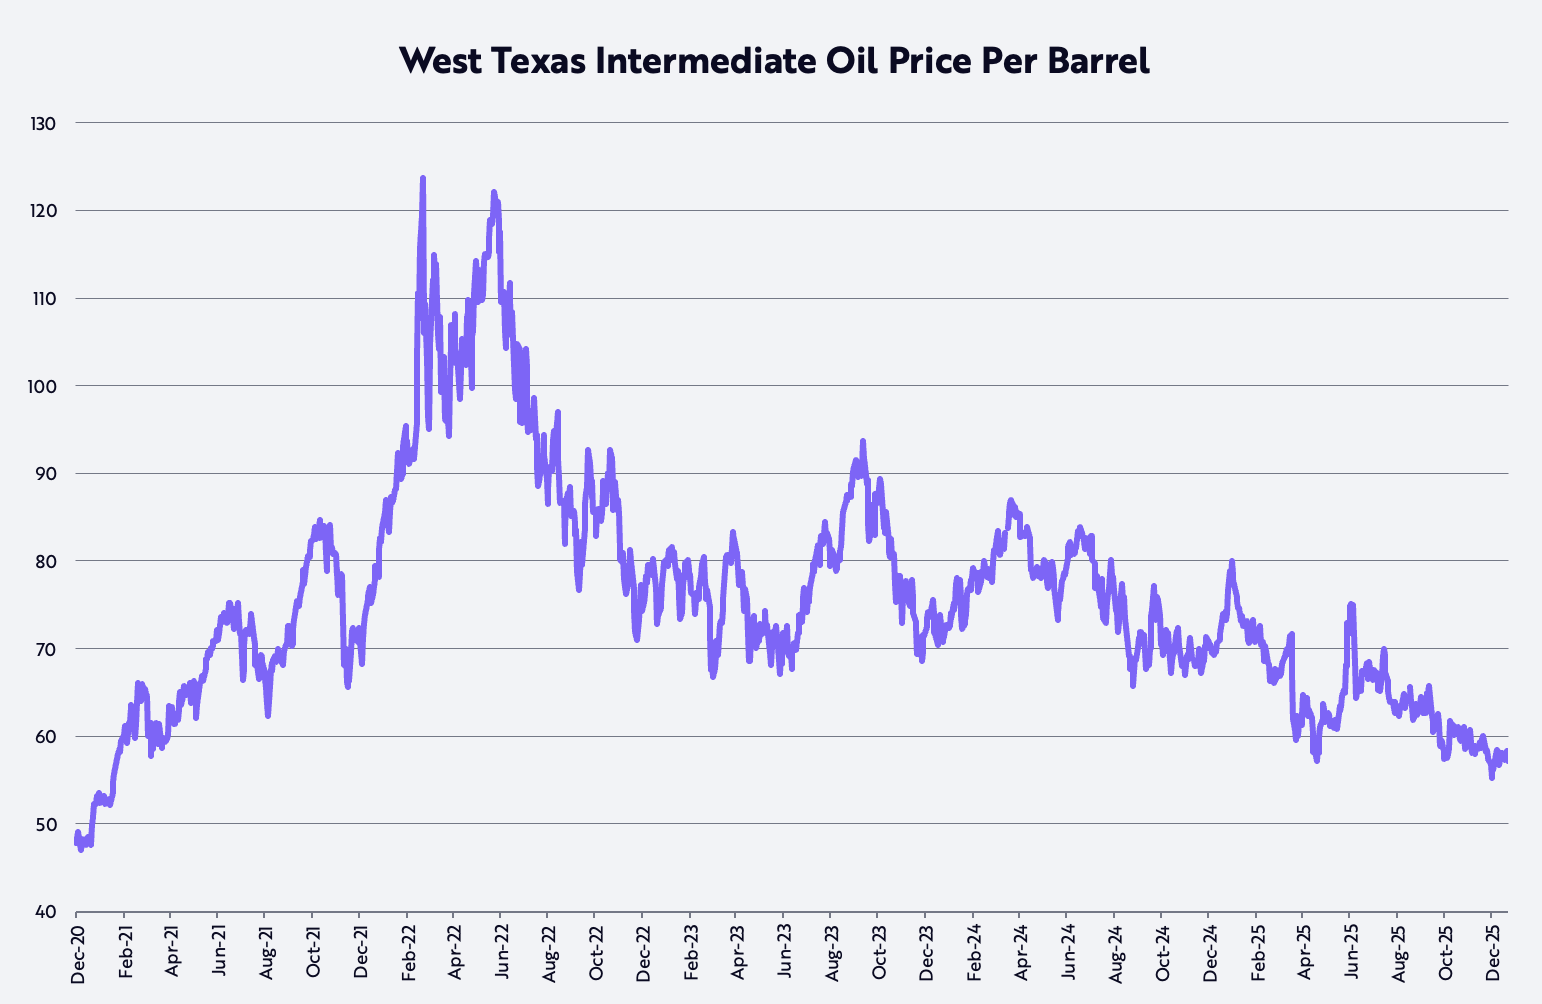
After hovering stubbornly in the 2-3% range for the last few years, inflation, as measured by the Consumer Price Index (CPI), is likely to drop to a surprisingly low—if not negative—rate during the next few years, for several reasons illustrated in the charts below. First, from its post-COVID high at ~$124 on March 8, 2022, the West Texas intermediate oil price per barrel has dropped ~53% and is now down ~22% on a year-over-year basis.
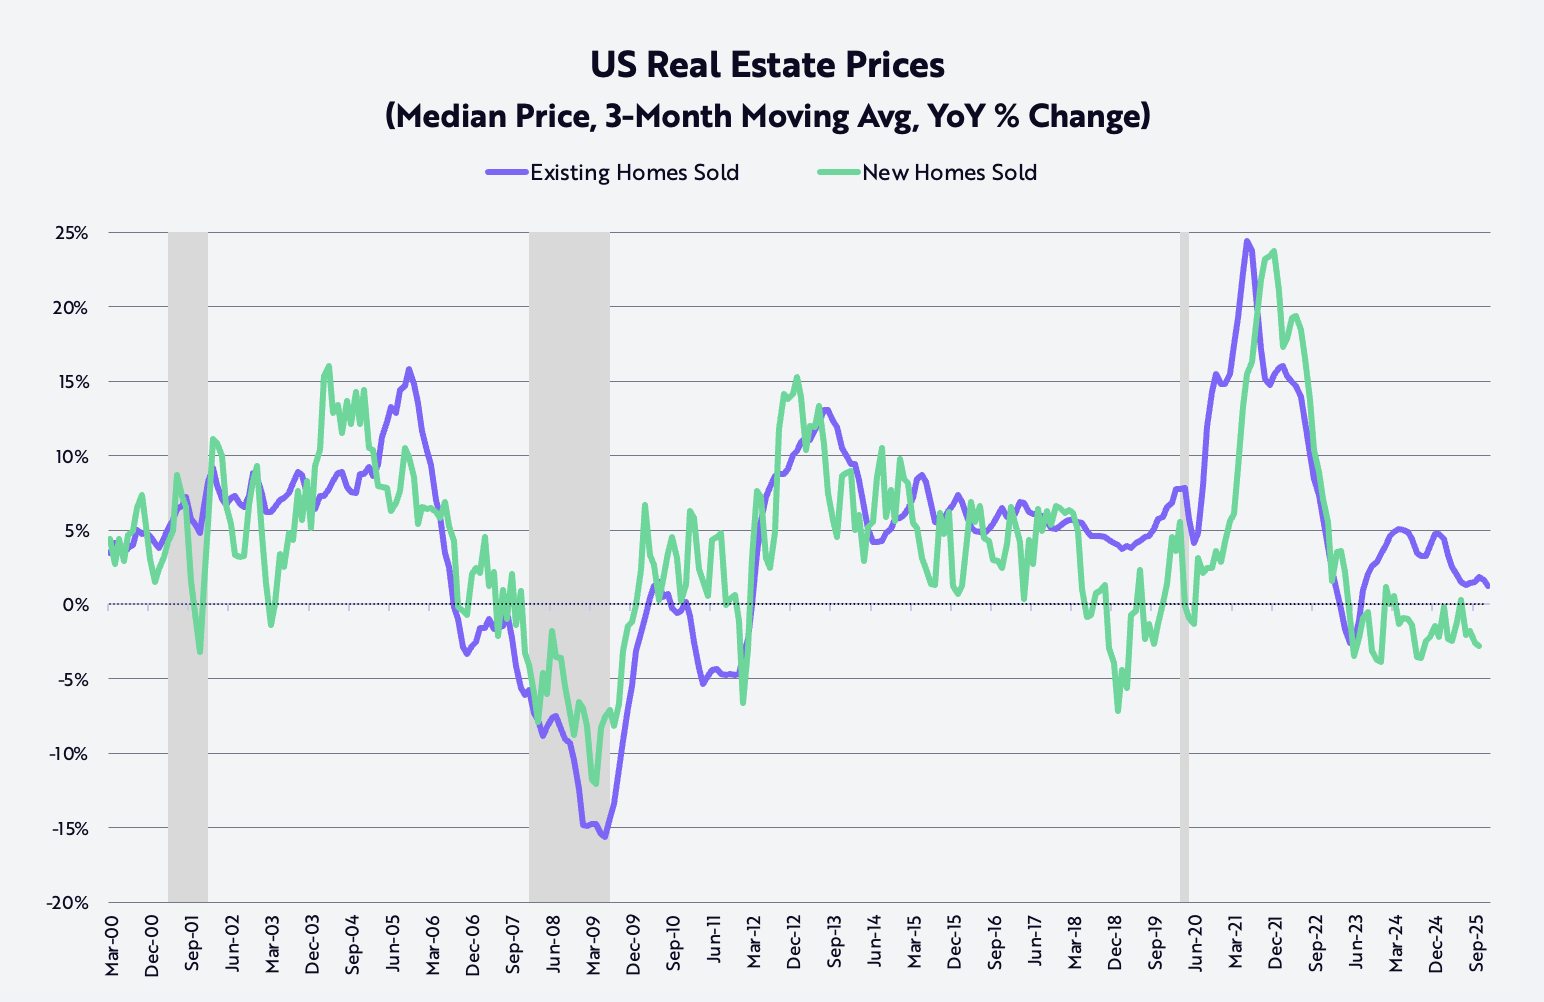
Since peaking in October 2022, new single-family home sale prices are down ~15%, while existing single-family home price inflation—based on a three-month moving average—has dropped from ~24% on a year-over-year basis at its post-COVID peak in June 2021 to ~1.3%, as shown below.
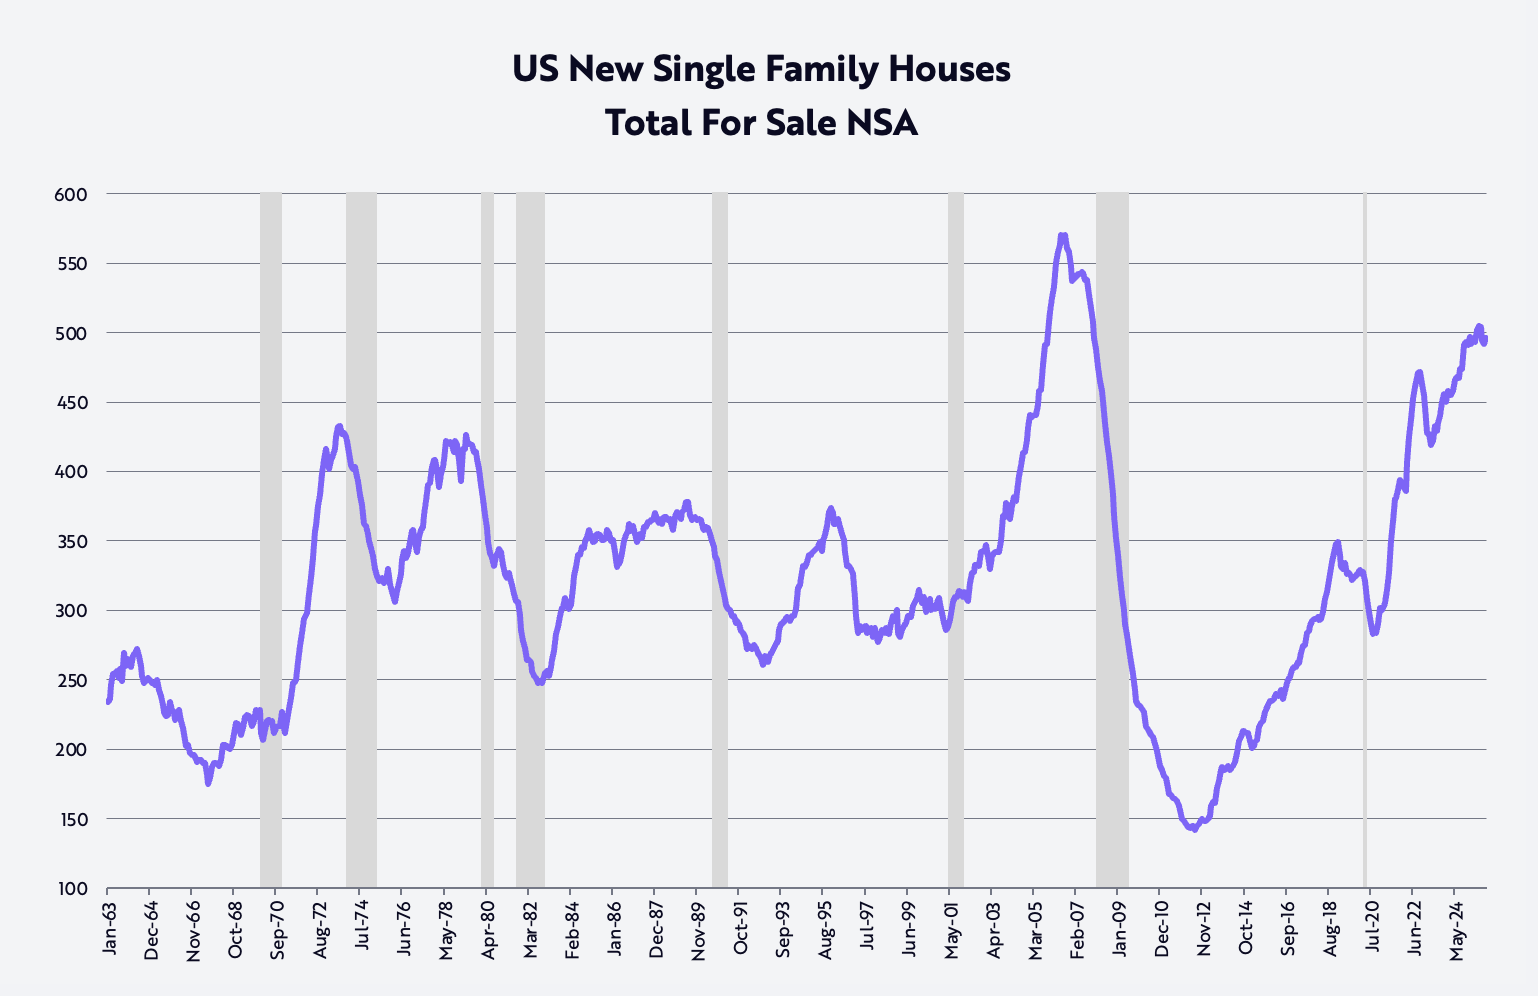
During the fourth quarter, to clear the new single-family home inventory that has approached 500,000—a level not seen since just before the Global Financial Crisis in October 2007, as shown below—three major homebuilders cut prices significantly on a year-over-year basis: Lennar -10%, KB Homes -7%, and D.R. Horton -3%. Those price declines will seep into the CPI with a lag during the next few years.
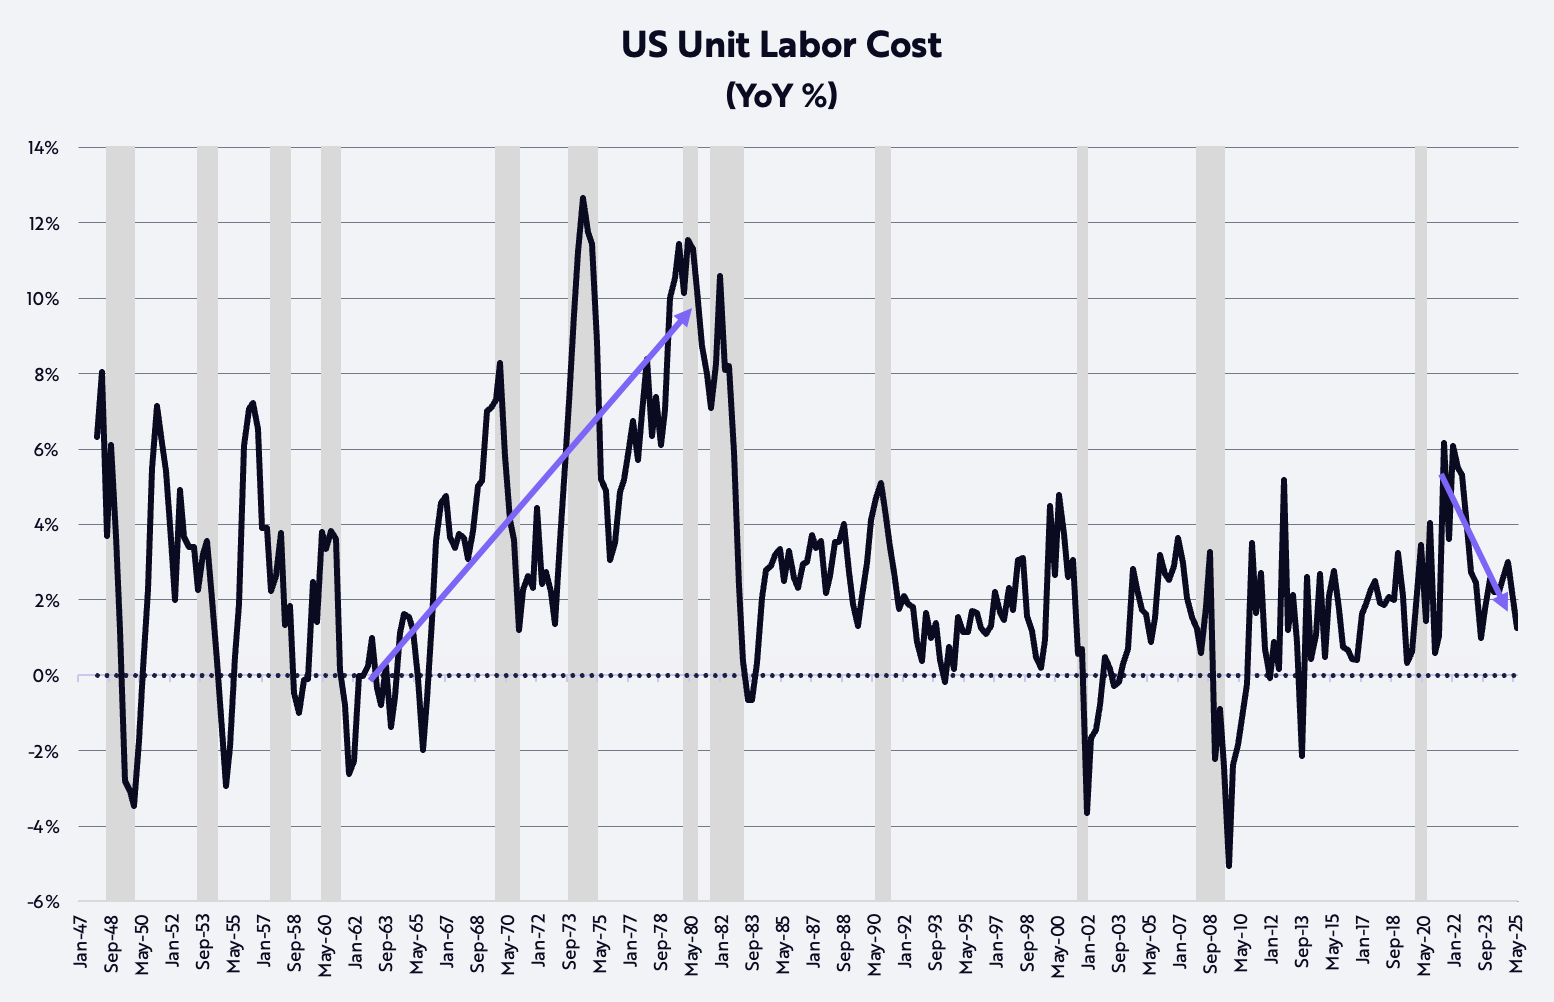
Finally, non-farm productivity, one of the most powerful forces against inflation, has defied the rolling recession and was up 1.9% on a year-over-year basis during the third quarter. Juxtaposed against the 3.2% gain in compensation per man-hour, productivity gains have lowered unit labor cost inflation to 1.2%, as shown below. No Seventies-style cost-push-inflation in that number!
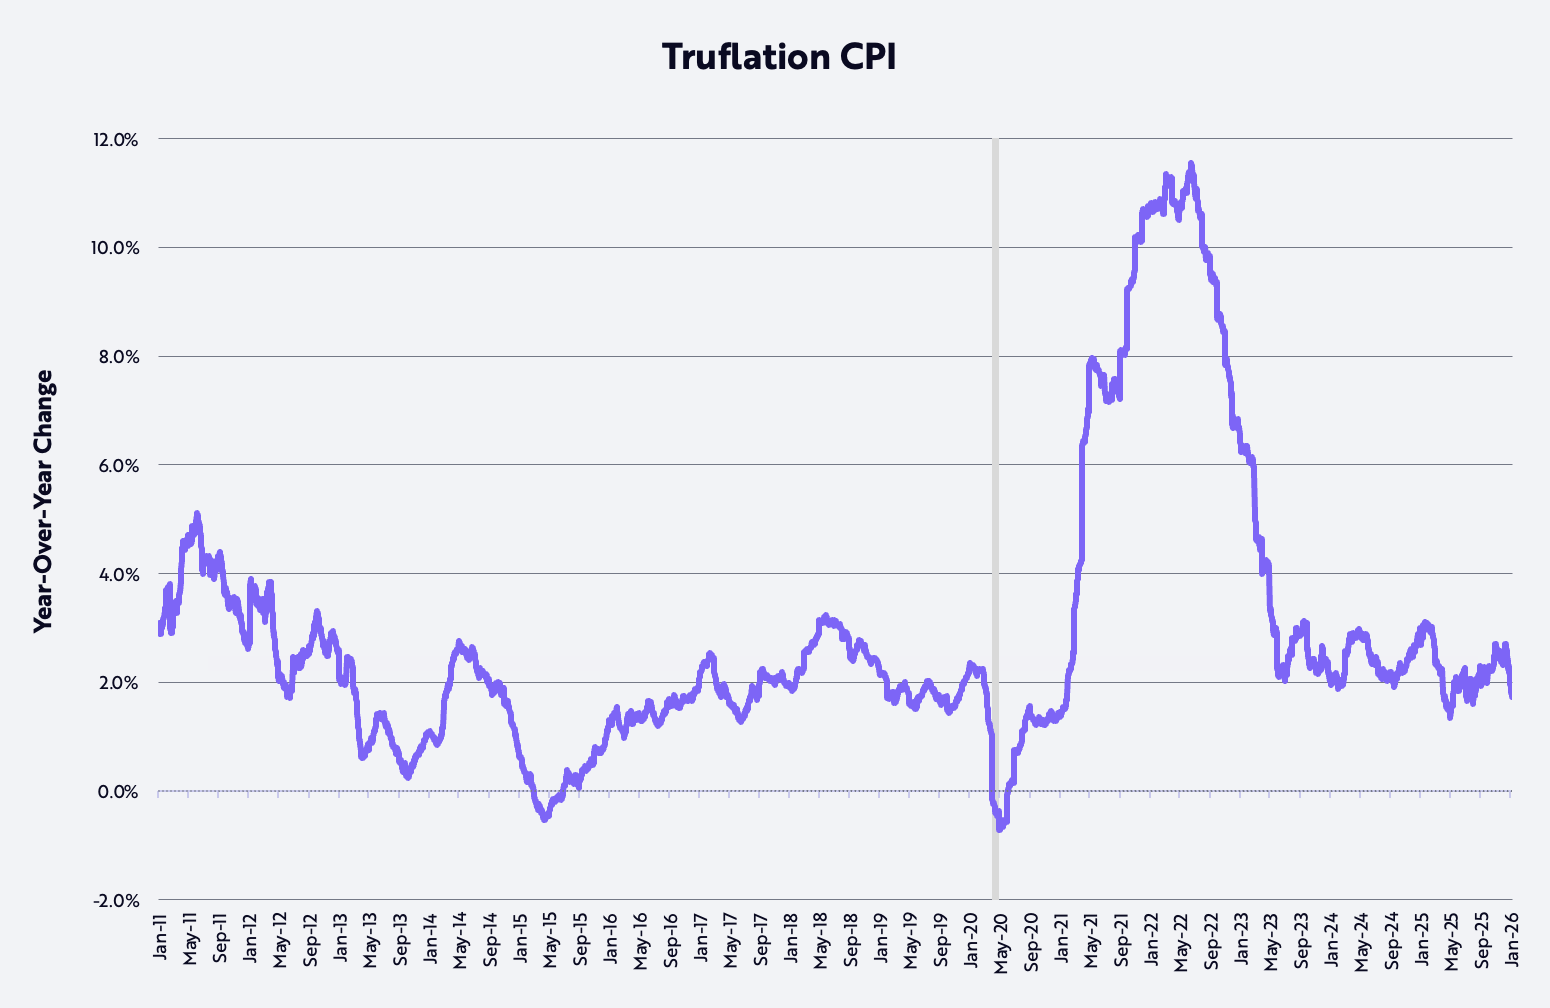
Confirming the improvement, inflation as measured by Truflation1 has declined recently to 1.7% year-over-year, as shown below, nearly 100 basis points (bps)2 lower than the BLS (Bureau of Labor Statistics) calculation of CPI-based inflation.
Productivity Boom
Indeed, if our research on technologically enabled disruptive innovation is correct, non-farm productivity growth should accelerate to 4-6% on a year-over-year basis for both cyclical and secular reasons during the next few years, driving unit labor cost inflation even lower. Convergences between and among the major innovation platforms evolving today—AI, robotics, energy storage, public blockchain technology, and multiomics technology—are likely not only to push productivity growth to sustainable new highs but also to generate significant wealth creation.
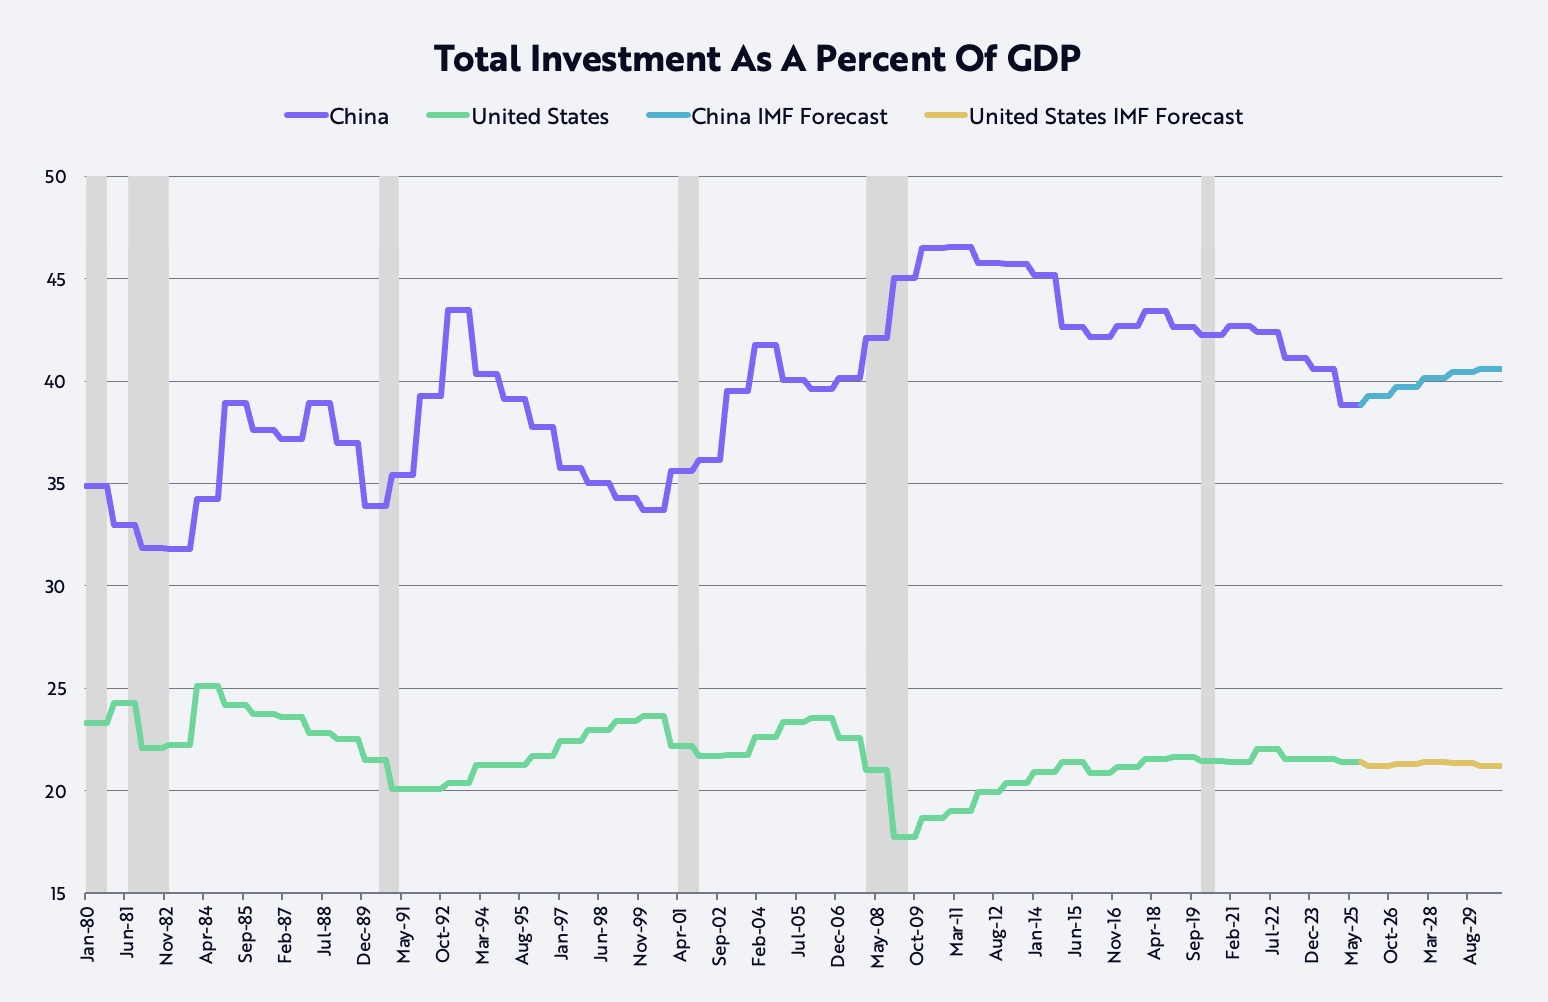
Productivity also could redress significant geo-economic imbalances in the global economy. Companies can channel productivity gains in one or more of four strategic directions: margin expansion, increased R&D and other investment, higher compensation, and/or lower prices. In China, higher compensation for more productive workers and/or higher margins could help rebalance the economy away from excessive investment that has averaged 40% of GDP—nearly double that in the US—since it entered the WTO (World Trade Organization) in 2001, as shown below. Boosting compensation would rebalance the Chinese economy toward consumption and away from commoditization, serving President Xi Jinping’s anti-involution goal.3 At the same time, US companies could increase investment and/or lower prices, becoming even more competitive with their Chinese counterparts.
That said, in the short term, technologically enabled productivity gains could continue to slow employment growth in the US, driving the unemployment rate up from 4.4% to 5.0%+ and encouraging the U.S. Federal Reserve (Fed) to continue cutting interest rates. Thereafter, deregulation and other fiscal stimuli should turbocharge the impact of lower interest rates and accelerate GDP growth during the second half of 2026. At the same time, inflation is likely to decelerate, thanks not only to lower oil prices, home prices, and tariffs, but also to the same technologies driving productivity higher and unit labor costs lower.
Astonishingly, AI training costs are declining 75% per year, and AI inference costs—the costs to run models for AI applications—are dropping up to 99% per year, according to some benchmarks. Unprecedented declines in the cost of various technologies should lead to booms in their unit growth. As a result, we would not be surprised to see nominal US GDP growth hover in the 6-8% range during the next few years, thanks to 5-7% growth in productivity, 1% growth in the labor force, and -2% to +1% inflation.
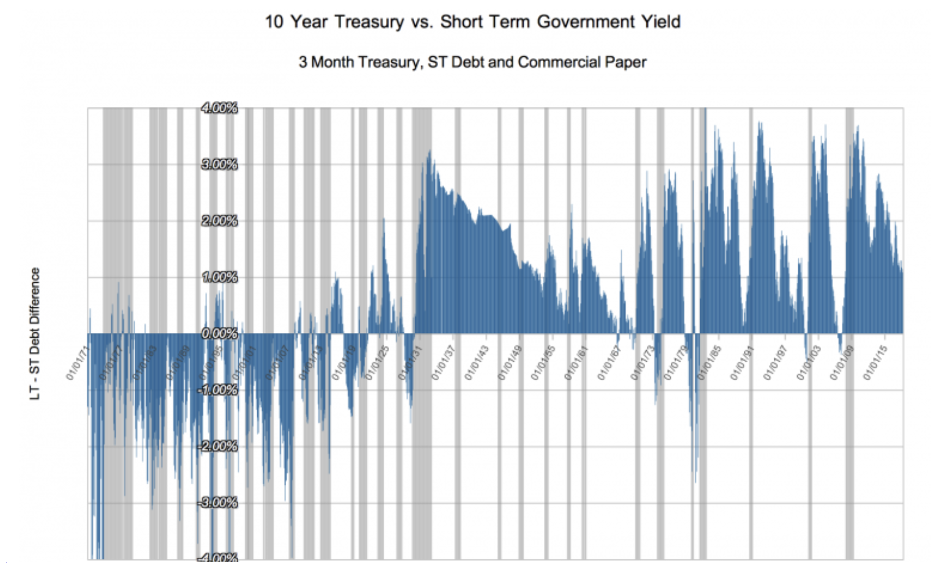
The deflationary impact of AI and the other four innovation platforms should cumulate and create an economic backdrop much like that during the last major technology revolution created by the internal combustion engine, electricity, and telephony in the 50 years ended 1929. During that period, short-term interest rates mirrored nominal GDP growth while long-term interest rates responded to the deflationary undercurrents associated with the boom in those technologies, inverting the yield curve by 100 basis points on average, as shown in the chart below.4
OTHER NEW YEAR THOUGHTS
Gold Price Appreciation vs Bitcoin Price Depreciation
During 2025, the gold price appreciated 65% as the price of bitcoin slipped 6%. While many observers have attributed the 166% surge in the gold price from $1,600 to $4,300 since the end of the US equity bear market in October 2022 to the risk of inflation, another interpretation is that global wealth creation, as exemplified by the 93% increase in the MSCI World Equity Index,6 has outpaced the ~1.8% annualized increase in the gold supply globally. In other words, the incremental demand for gold could be outstripping its supply growth. Interestingly, during the same time, the price of bitcoin has increased 360% in the face of a ~1.3% annualized increase in its supply. An important consideration relevant to this comparison is that gold and bitcoin miners are likely to respond to these price signals differently: gold miners, by boosting production of gold, something not possible with bitcoin. Bitcoin is mathematically metered to increase ~0.82% per year for the next two years, at which point its growth will decelerate to ~0.41% per year.
The Gold Price In Perspective
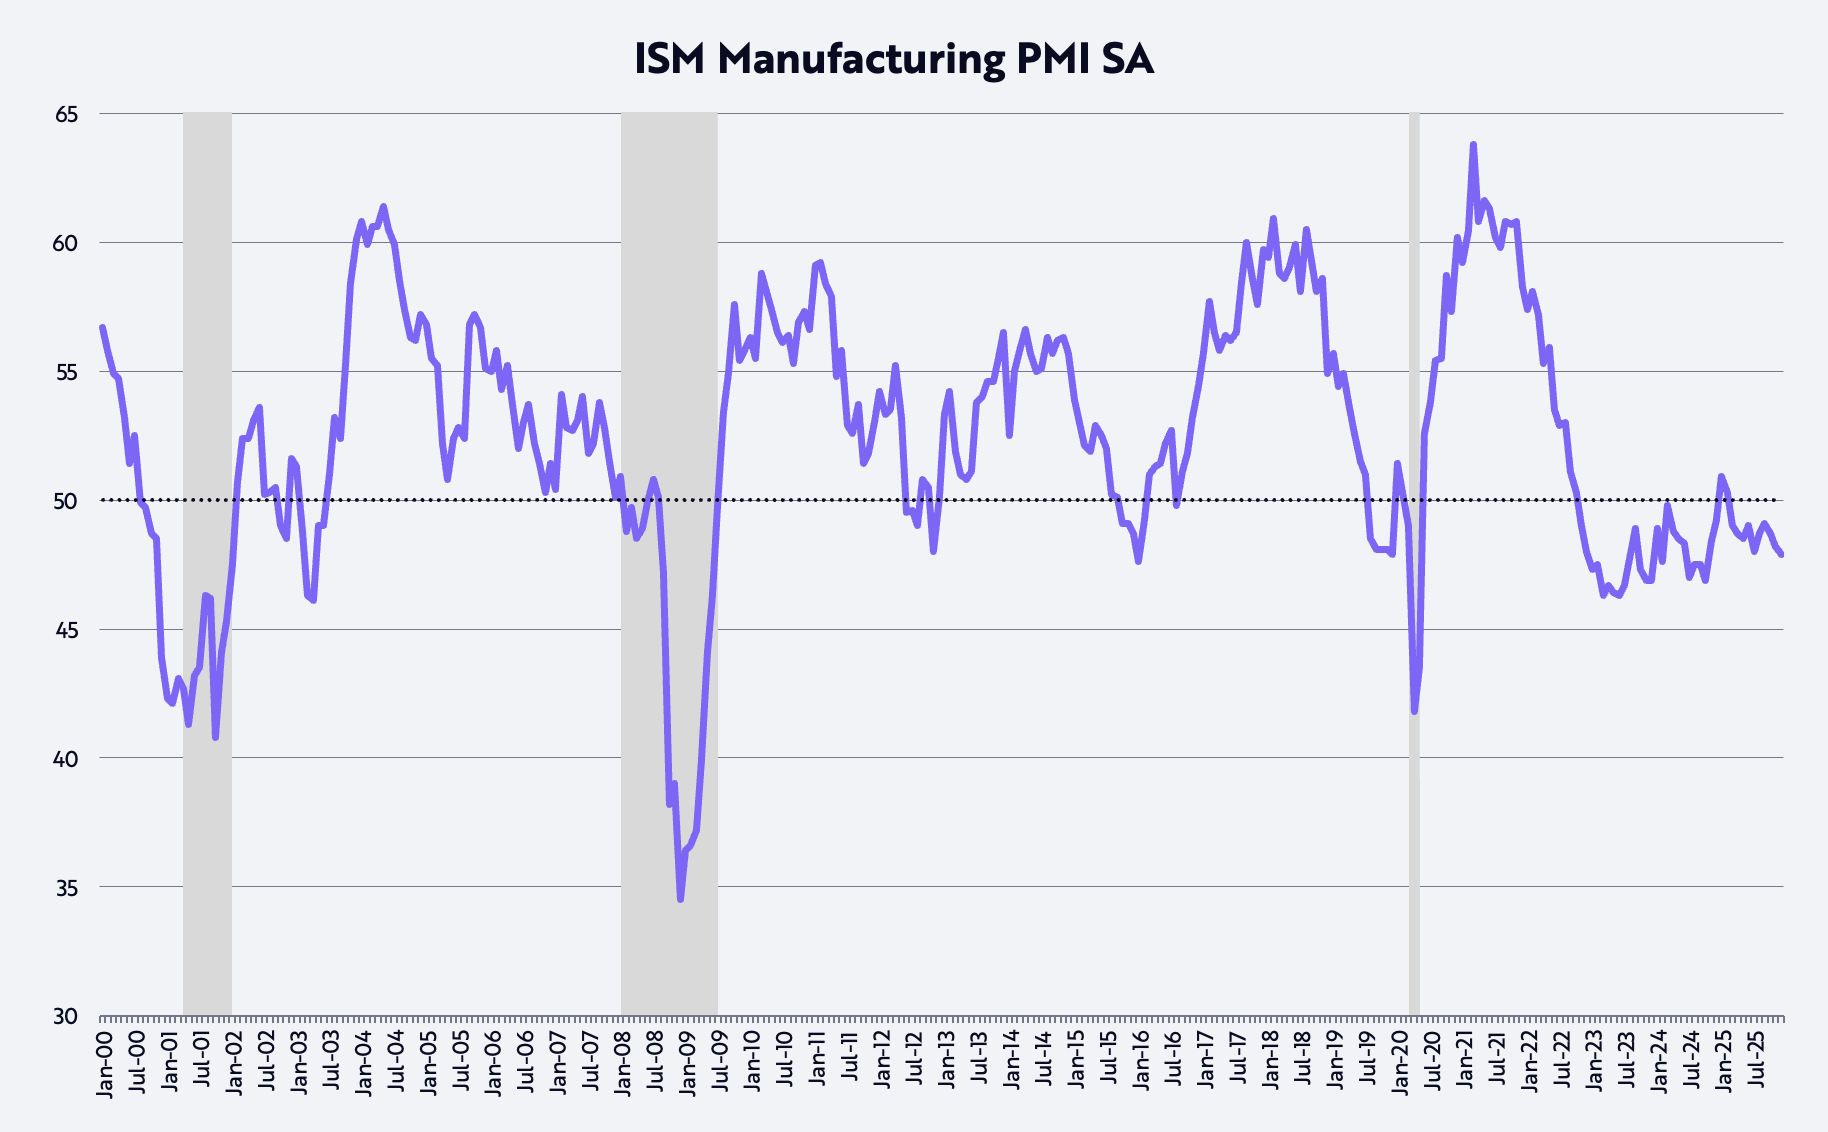
As measured by the ratio of its market cap to M2,7 gold has been higher only once in the past 125 years, during the Great Depression in the early 1930s when the gold price was fixed at $20.67 per troy ounce and M2 imploded by ~30%, as shown below. Recently, the Gold-M2 ratio surpassed its previous peak, which occurred when inflation and interest rates were soaring to double-digits in 1980. In other words, in the context of history, the gold price has reached extreme levels.
Also notable from the chart below, long-term declines in this ratio have been associated with solid returns in the equity markets. Since 1926, according to Ibbotson and Sinquefield, equities have returned ~10% at a compound annual rate.8 After the two major secular peaks in this ratio in 1934 and 1980, respectively, equity prices as measured by the DJIA (Dow Jones Industrial Average) returned 670% and 1,015%, or 6% and 12% annualized, respectively, during the 35 and 21 years ended in 1969 and 2001. Notably, small cap returns9 averaged 12% and 13%, respectively, at an annual rate.
Another important consideration for asset allocators is the low correlation of bitcoin returns relative not only to gold returns but also to those of any other major asset class since 2020, as shown in the table below. Interestingly, the correlation between bitcoin and gold is lower than that between the S&P 500 and bonds. In other words, bitcoin should be a good source of diversification for asset allocators looking for higher returns per unit of risk during the years ahead.
Correlation Matrix
| Bitcoin | Gold | Commodities | S&P 500 | Bonds | REITS | |
| Bitcoin | 0.14 | 0.20 | 0.28 | 0.06 | 0.15 | |
| Gold | 0.14 | 0.45 | 0.24 | 0.30 | 0.29 | |
| Commodities | 0.20 | 0.45 | 0.37 | 0.00 | 0.34 | |
| S&P 500 | 0.28 | 0.24 | 0.37 | 0.27 | 0.79 | |
| Bonds | 0.06 | 0.30 | 0.00 | 0.27 | 0.39 | |
| REITS | 0.15 | 0.29 | 0.34 | 0.79 | 0.39 |
The Dollar’s Outlook
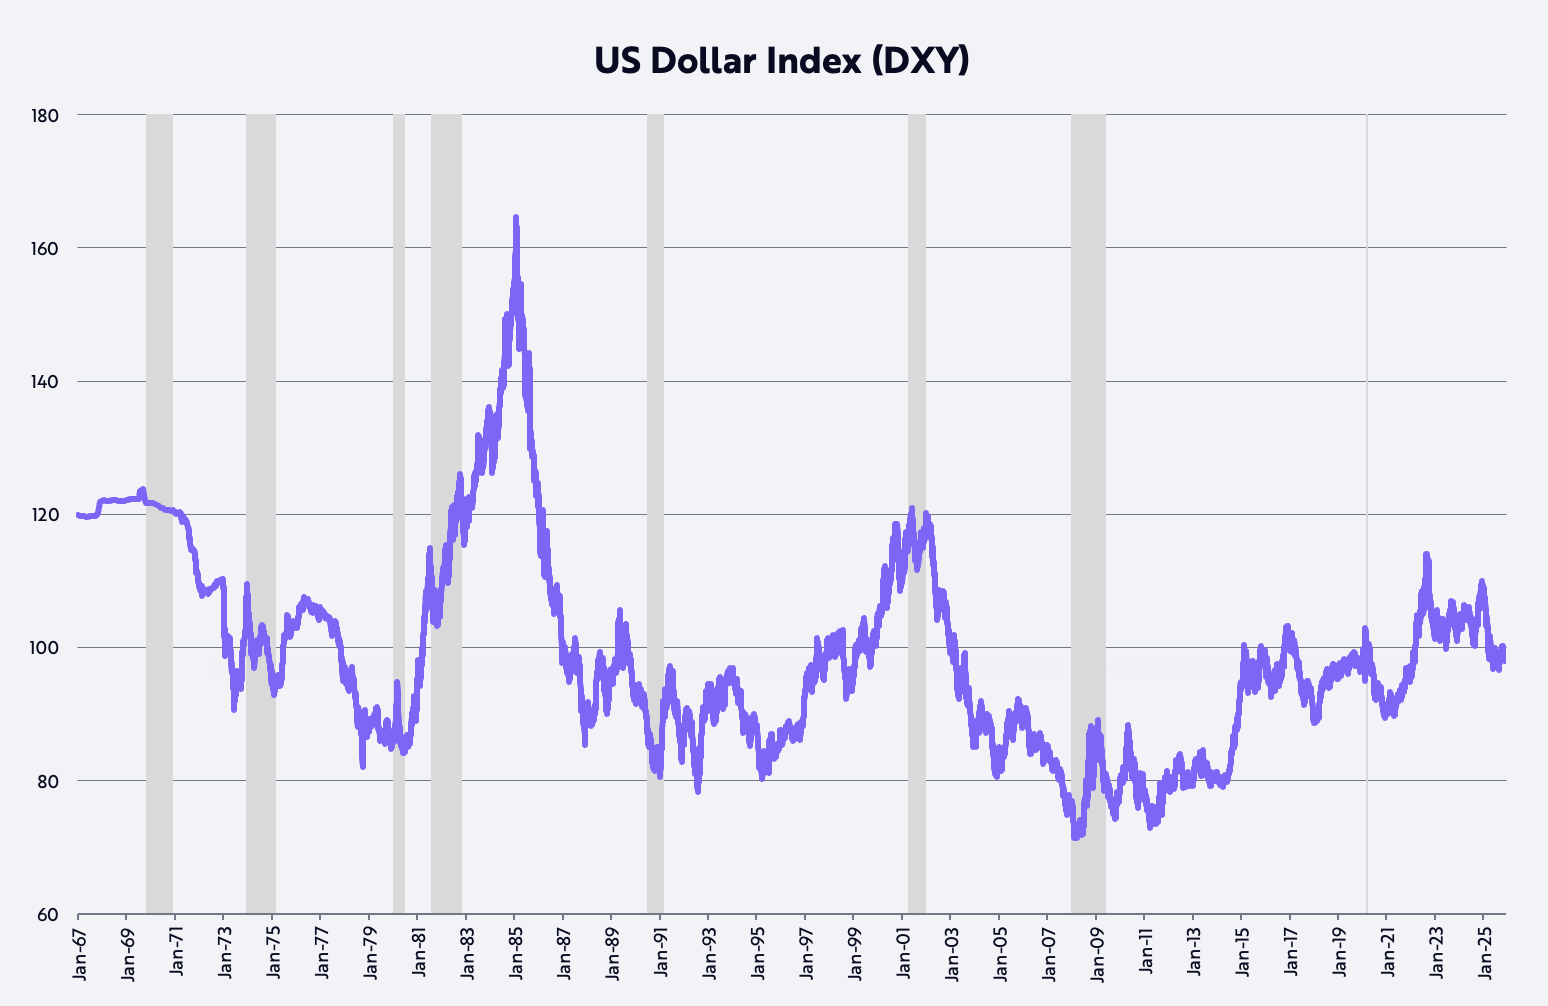
A popular narrative during the last few years has been the end of US exceptionalism, as exemplified by the most significant decline in the dollar during the first half of a year since 1973 and on a calendar year basis since 2017. Last year, as measured by the trade-weighted dollar (DXY), the dollar dropped 11% during the first half of the year and 9% for the full year. If our outlook for fiscal policy, monetary policy, deregulation, and US-driven technological breakthroughs is correct, the return on invested capital in the US will increase relative to that in the rest of the world, driving the dollar higher. The Trump Administration’s policies are echoing the early days of Reaganomics in the 1980s, when the dollar nearly doubled, as shown below.
AI Hype
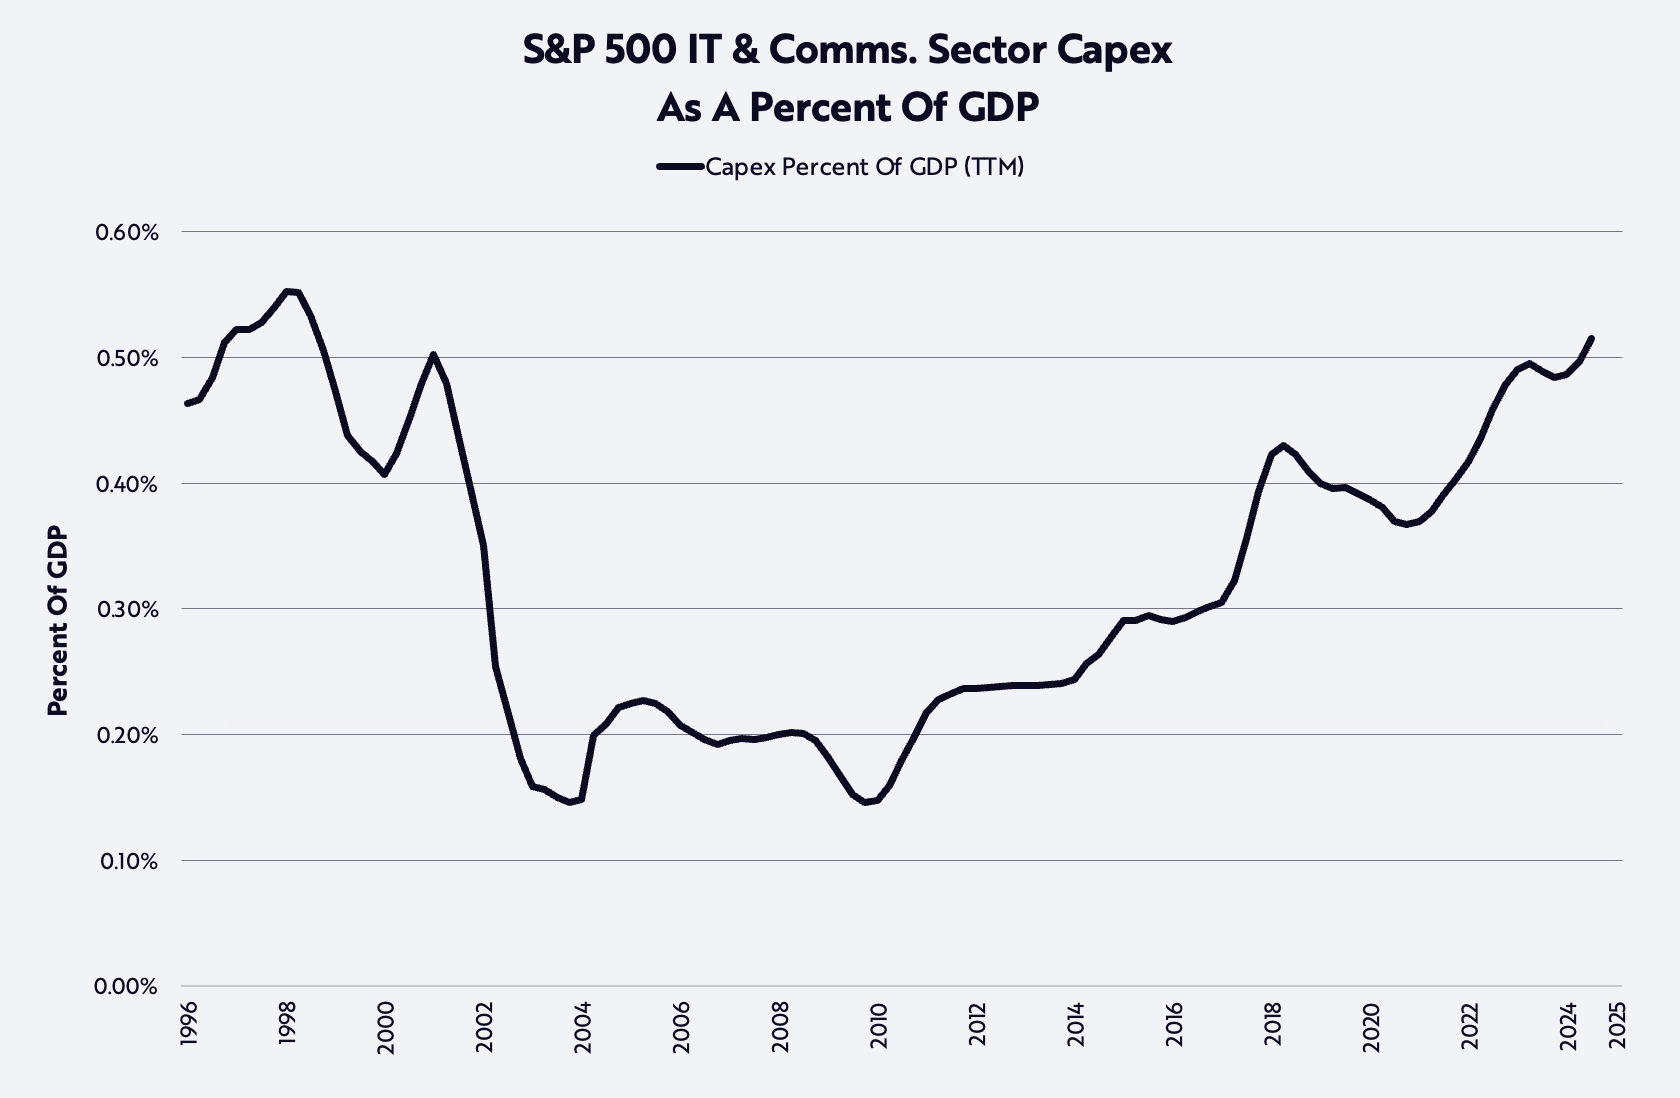
The AI boom is driving capital spending to highs not seen since the late nineties, as shown below. In 2025, investment in data center systems—compute, networking, and storage equipment—grew 47% to nearly $500 billion and is expected to grow another 20% in 2026 to ~$600 billion, well above the long-term trend of $150 to $200 billion per year in the ten years prior to the launch of ChatGPT.10 Investment of that magnitude begs the question: “What and where will the returns be on this investment?”
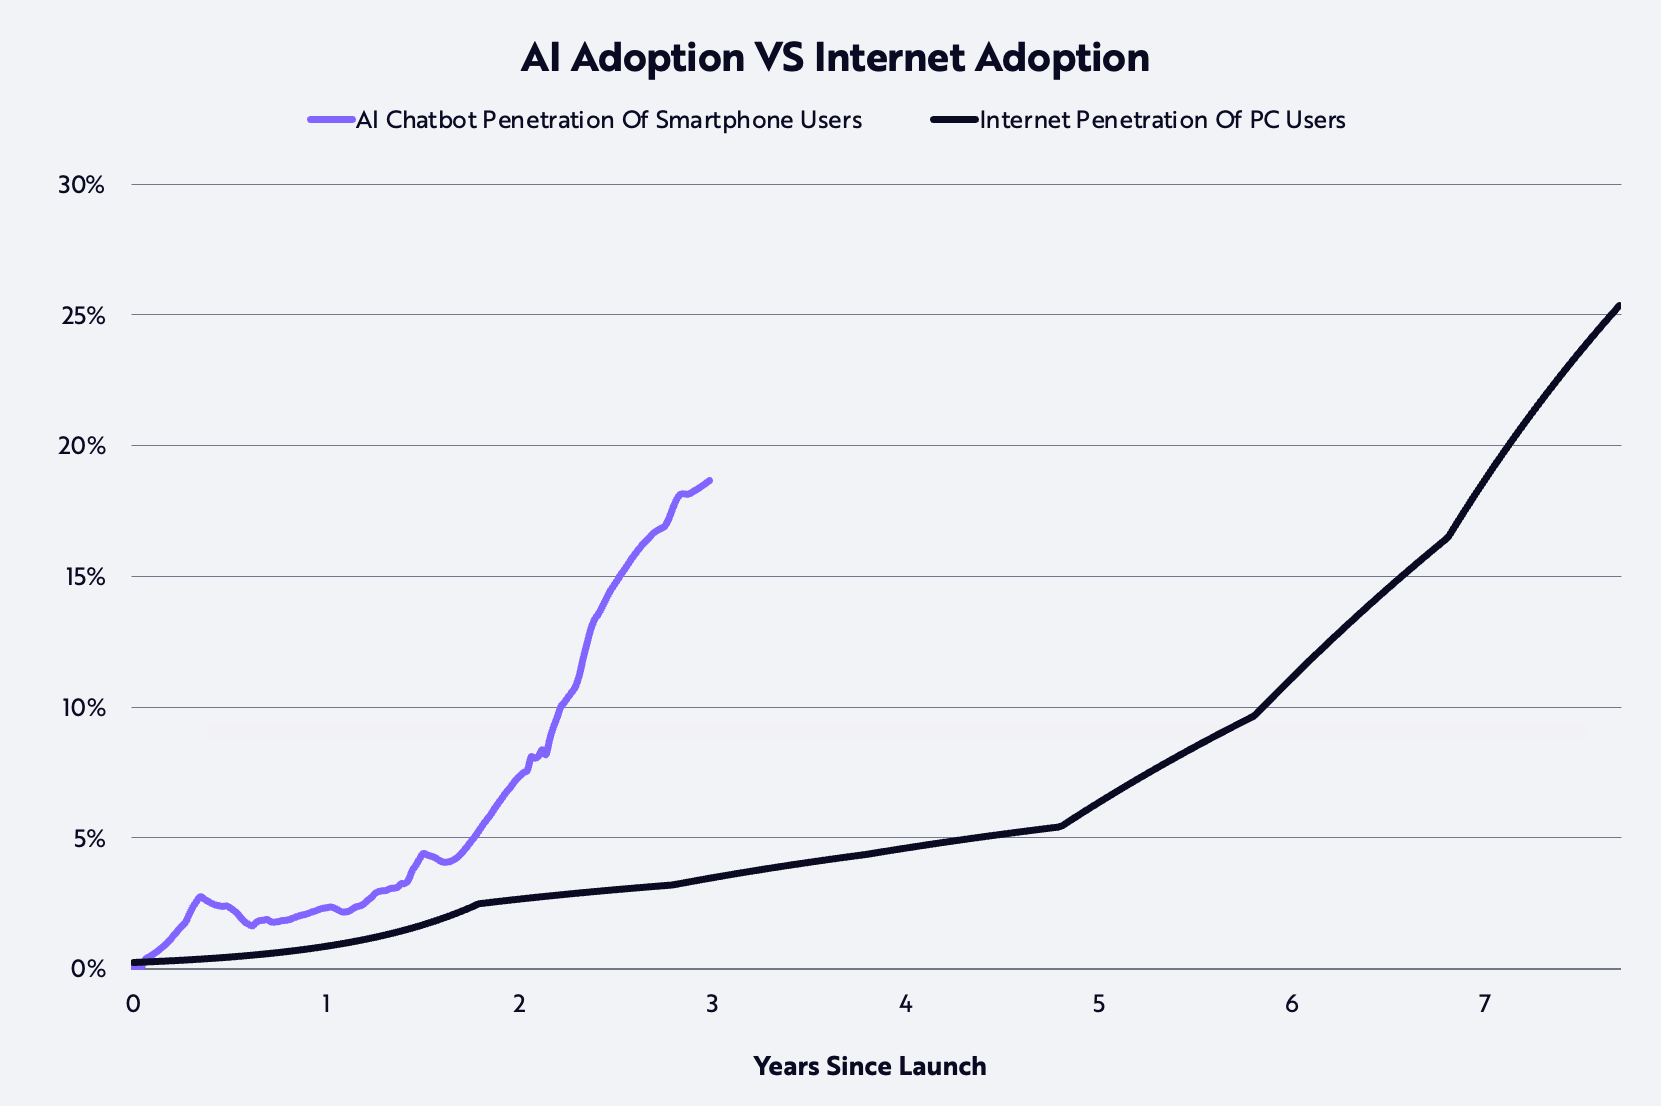
Beyond semiconductors and the major cloud companies in the public equity markets, the growth and returns on investment are benefiting AI-natives yet to enter the public markets. AI companies are some of the fastest growing businesses in history. According to our research, consumers are adopting AI at twice the pace at which they adopted the internet in the nineties, as shown below.
By year-end 2025, OpenAI and Anthropic reportedly reached annualized run rate revenues of $20 billion and $9 billion, respectively, up 12.5x and 90x from $1.6 billion and $100 million, respectively, in just one year! Rumors suggest that both companies are considering initial public offerings (IPOs) in the next year or two to help fund the massive investment required to serve the models that power their products.
As expressed by OpenAI’s CEO of Applications, Fidji Simo, “AI models are capable of far more than how most people experience them day to day, and 2026 is about closing that gap. The leader in AI will be the company that turns frontier research into products that are undeniably useful for people, businesses, and developers.” This year should see material steps forward on this front through user experiences that are more intentional, intuitive, and integrated. One early example is ChatGPT Health, a zone inside ChatGPT dedicated to helping users with health and wellness based on their personal health data.
In the enterprise, many AI implementations are in early days, delayed by bureaucracy, inertia, and/or the prerequisite to reorganize and build the data foundations necessary to make AI useful. In 2026, organizations likely will learn that they need to train models on their own data and iterate quickly, or risk being left behind by more aggressive competitors. AI-powered use cases should deliver instant and exceptional customer service, faster product releases, and startups doing more with less.
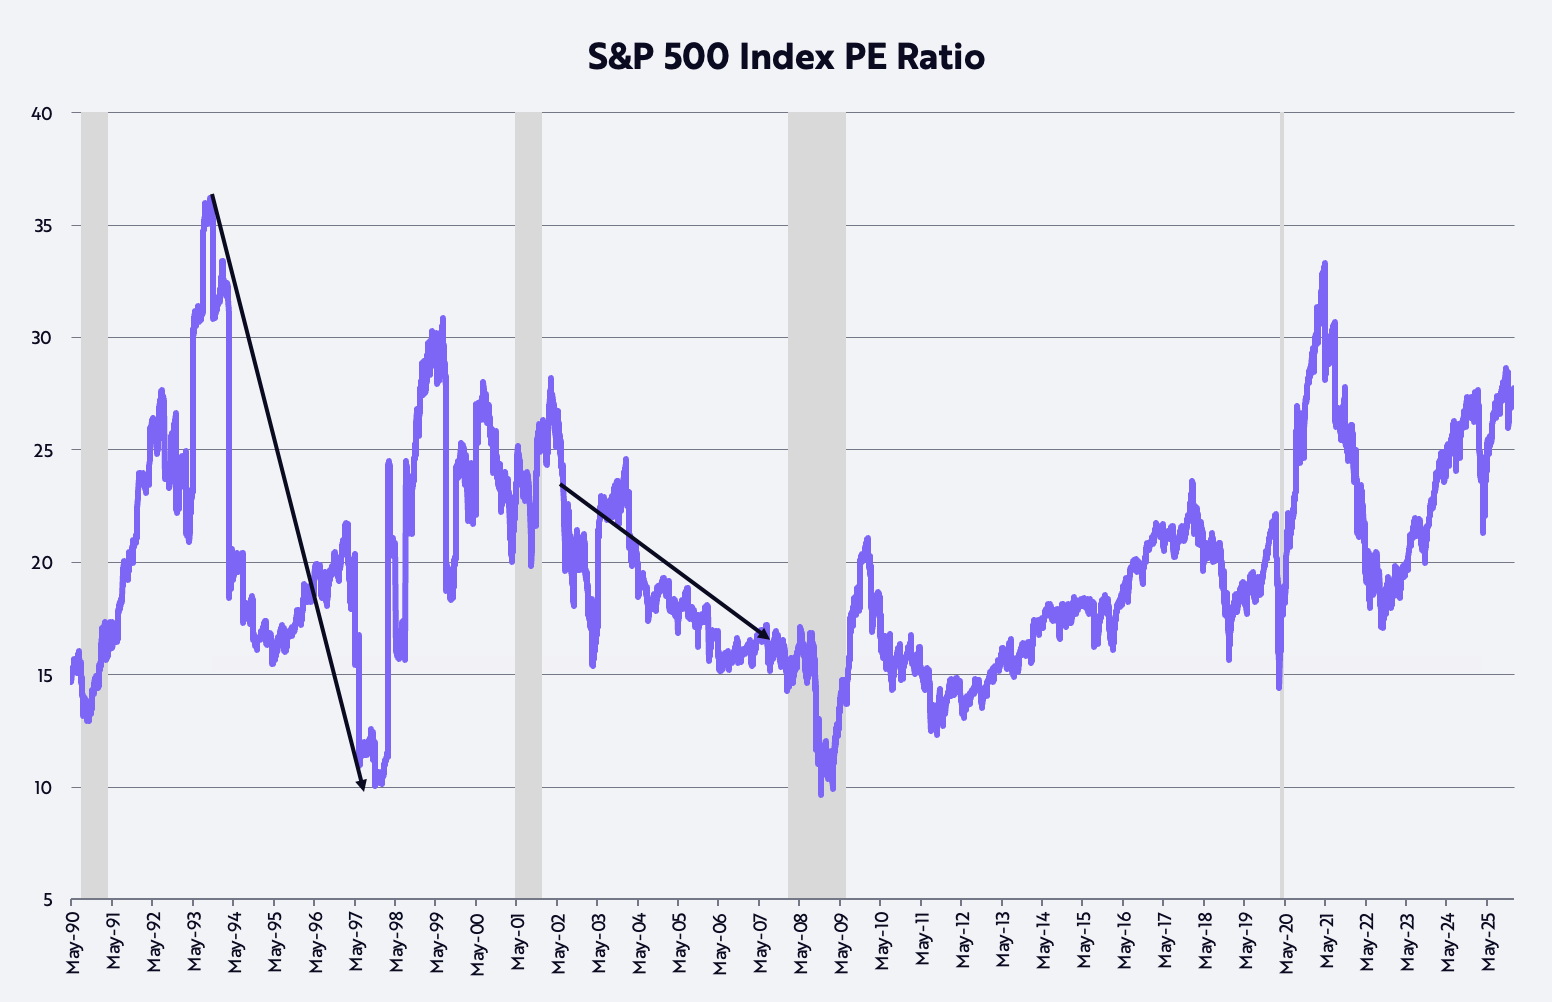
High Valuation Of The Market
Many investors are concerned about the valuation of the equity market, which is at the high end of its historical range, as shown below. Our own valuation assumption is that price-to-earnings (P/E) multiples will drop back toward the 20x average in place over the last 35 years. Some of the most notable bull markets have evolved as multiples compressed. From mid-October 1993 to mid-November 1997, for example, the S&P 500 returned 21% at an annual rate as its P/E multiple dropped from 36x to 10x. Likewise, from July 2002 to October 2007, the S&P 500 returned 14% at an annual rate as its P/E compressed from 21x to 17x. Given our outlook for a productivity-driven acceleration in real GDP growth and deceleration in inflation, the same dynamic should play out—perhaps more dramatically—in this market cycle.
With many thanks, as always, to ARK’s investors and other supporters, and to Dan, Will, Katie, and Keith for helping me craft this voluminous New Year Letter!
Cathie

